
Data Grid
Very quickly, the raw amount of data collected is too vast to be used in one piece. For instance, some 5 years with 20 sites and monthly data entry of 100 indicators you'd have ten thousand raw data points and even more consolidated and computed ones on top of that. In fact, some companies using SERAM have collected several million of raw data points and compute many more figures out of these.
Depending on the need, very different views on the data are relevant. Someone may want to see some indicators on the group level, someone else might need to see one indicator over all times and sites, etc. This is where the Data Grid comes into play.
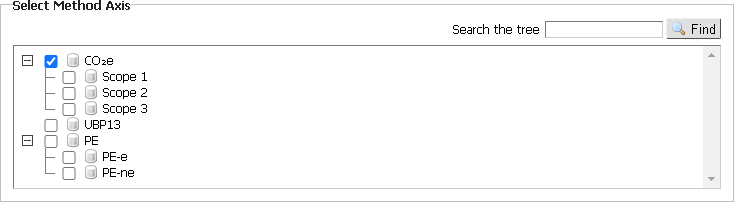
The four axes
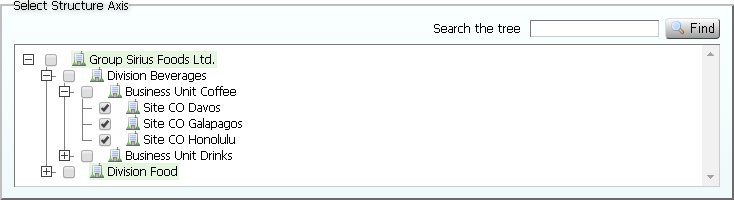
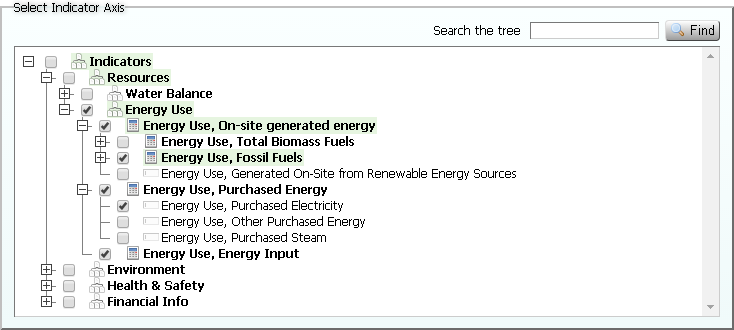
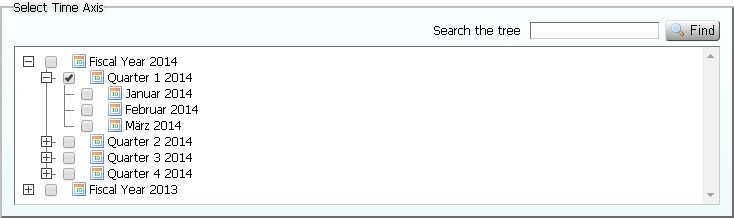
To access data, the user just needs to make a selection in each of the four axes. The default method is preselected, so that the user is not required to make a method selection. Of course, if a user has access to only one site, that axis will be pre-selected any only indicators and time needs to be selected.
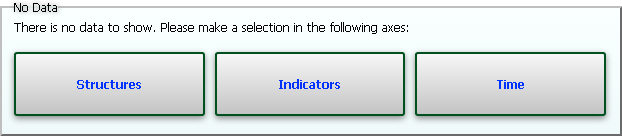
The Data Grid
After making the selection as above, the data is displayed on-screen:
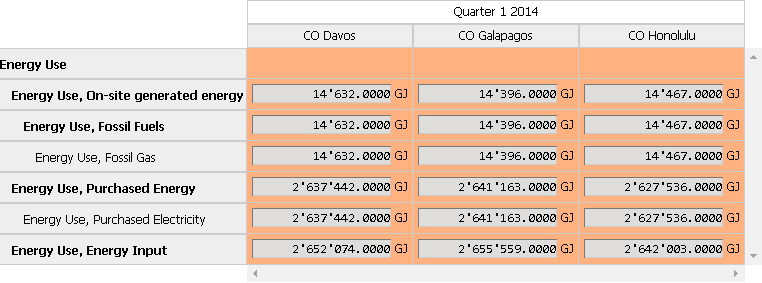
By default, SERAM will try to set the layout of the axes so that the required view appears. Here is an example with many structures, one indicator and two time indices:
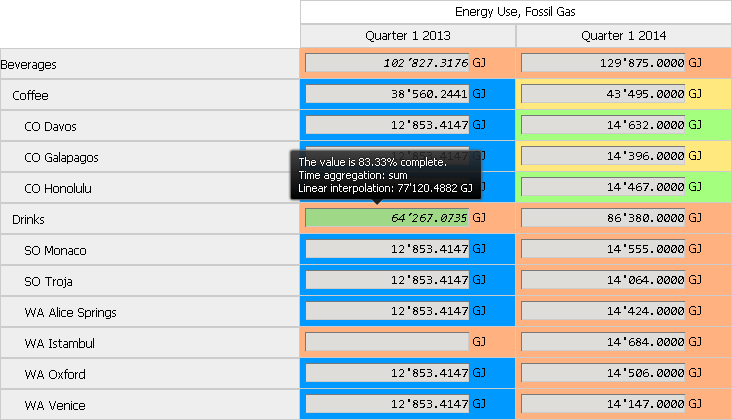
Note how the Data Grid shows much more information than just the values. The color code represents the data (workflow) status, italic means that some parts are missing from a consolidated value, and hovering with the mouse shows additional information such as the completeness, interpolation (for sums) and comments.
Actions
Many actions are available when a grid is loaded, including rendering data to charts, viewing the history of single values, dissecting consolidated or calculated values wuth a drill-down, batch-editing values, options for exporting and importing data, finding restatements, and much more.
The most important functionality is described on the other functionality pages.
Related Features:
Feature Categories:
- Verifying or Analyzing Data